
Why your reconnected social account shows a fake growth spike
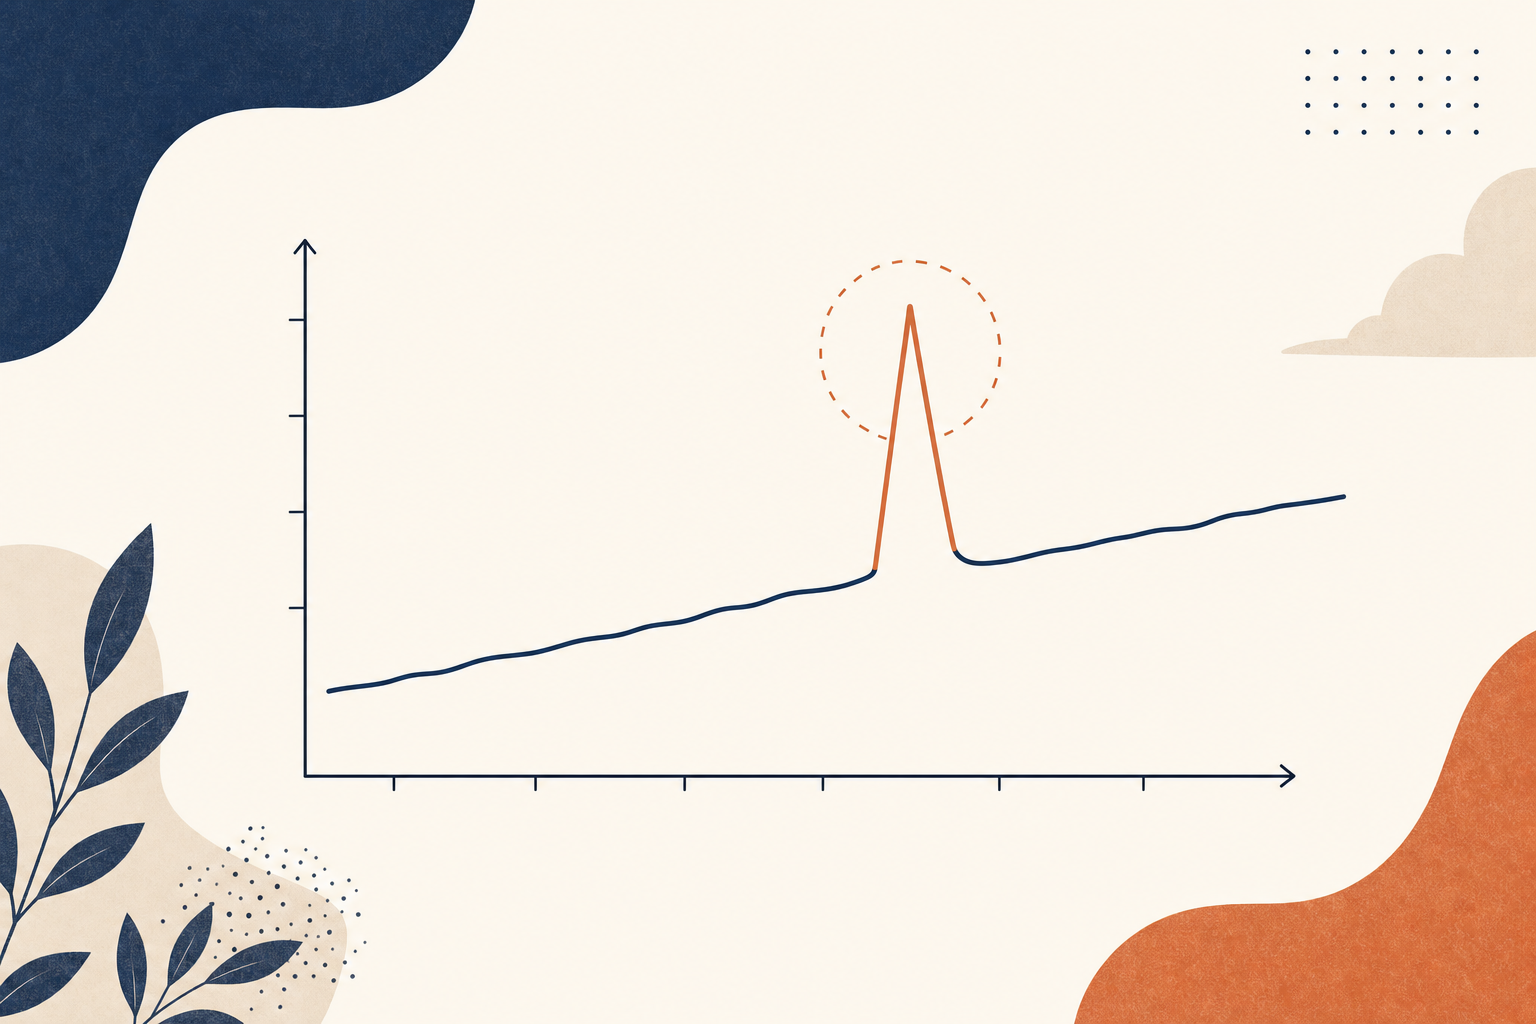
A client's Instagram follower count jumps 40% overnight. Nobody posted anything unusual. No influencer mentioned the account. The team gets excited for about a day, then someone checks the actual audience and realizes nothing changed except one thing: the account got reconnected after its access token expired. The "spike" was never real. It was a reporting artifact, and if nobody catches it, it becomes a permanent, wrong data point sitting in a monthly report.
This happens more often than most people managing social accounts realize, and it's rarely caught in the moment, because a growth spike doesn't look suspicious. It looks like good news, which is exactly why it tends to get celebrated first and questioned later, if it gets questioned at all.
Why this happens
Social platforms don't hand out permanent access. Every connected account runs on a token that expires or needs periodic reauthorization, and when that happens, most reporting tools have to reconnect and start measuring from wherever the account's real count is at that moment. If the tool wasn't tracking growth carefully before the disconnect, the gap between the last known number and the freshly reconnected number can look exactly like organic growth, when it's really just 2 different measurements of an account that never actually moved that much.
The same thing happens in reverse. A reconnect that lands on a lower number than what was last recorded can look like a follower cliff, sending someone into a panic about lost audience that was never actually lost. It was just measured differently on either side of a routine reauthorization.
This isn't a hypothetical edge case
It's common enough that some of the better-known tools in this category have documented it themselves. Vista Social, Metricool, and Buffer's own help documentation each acknowledge that follower data isn't backfilled on account reconnect, meaning a reconnected account can show a growth spike that never happened. That's not a knock on those specific tools so much as a sign of how common the underlying problem is across the category: token expiry is a fact of how every platform's API works, and any tool connecting to multiple accounts across multiple platforms will eventually hit it.
Anyone running paid social reporting or client-facing analytics should assume this will happen to some account, at some point, and ask what their tool does about it rather than assuming it's been handled.
What actually triggers a reconnect
Reconnects aren't rare edge cases limited to accounts that get mismanaged. They're a routine part of running social accounts through any third-party tool. Access tokens issued by Instagram, Facebook, LinkedIn, and the rest all have expiry windows, and platforms periodically force reauthorization for security reasons that have nothing to do with anything the account owner did. Add a password change, a 2-factor prompt that wasn't completed in time, or a platform-side policy update, and a perfectly healthy, well-run account can end up needing to reconnect multiple times a year.
Scale that across an agency running 40 or 50 client accounts, and reconnects aren't an occasional event, they're a near-constant background process. If even a fraction of those reconnects introduce a fake spike or cliff into the growth chart, that's a fraction of every client report carrying a data error nobody chose to put there.
Why a fake spike is worse than it sounds
A one-time bad data point sounds like a minor annoyance, but it does real damage in a few specific ways. First, it corrupts trend lines. A chart showing steady growth followed by an unexplained 40% jump, followed by steady growth again at the new baseline, either gets explained away with a made-up story about what caused it, or gets used to justify a decision (more budget, a strategy change) based on something that never happened.
Second, it erodes trust the moment it's caught. A client or stakeholder who spots an unexplained spike and asks about it, only to hear "oh, that's probably just a reconnection glitch," starts wondering what else in the reporting might be an artifact rather than reality. Analytics only work as a decision-making tool if the numbers are trusted by default. One caught fake spike puts that trust on notice for every future number, even the accurate ones.
Third, and least obvious, it can mask real problems. If an account genuinely lost followers around the same time a reconnect happened, the reconnect can absorb the drop into a "measurement glitch" story, and a real decline goes uninvestigated because it looked like noise instead of signal.
What normalized growth actually does
The fix is treating growth as something that needs correcting for known discontinuities, not something read directly off 2 raw snapshot numbers. Normalized growth tracking applies bounded deltas (a single measurement period can't show more change than is realistically possible for that account) and back-filled baselines, so a reconnect doesn't get treated as a real data point at all. Instead of "yesterday: 4,200 followers, today: 5,900 followers, that's a 40% jump," the system recognizes the reconnect event and either interpolates a sensible baseline or flags the gap as a known measurement discontinuity rather than reporting it as real movement.
Practically, this means the chart a client sees doesn't have an unexplained cliff or spike sitting in it every time an account gets reconnected, which happens more often than most people realize (expired tokens, app reauthorizations, and platform-side security changes all trigger it).
A worked example of what normalization changes
Say an account has 4,200 followers, its token expires, and 3 days pass before someone notices and reconnects it. By the time it's reconnected, the real count (which never stopped changing in the background) is 4,260, a completely normal 60-follower gain over 3 days for an account that size. But the reporting tool has no record of anything between the last known 4,200 and the freshly pulled 4,260, so depending on how it handles the gap, it might show that as a single-day 60-follower jump, which on a smaller account could easily read as a 1 or 2 percent spike with no explanation.
Normalized growth handles this by recognizing there's a 3-day gap in the data (not a single measurement point) and spreading that 60-follower change across the gap instead of dumping it all into one day, or by explicitly flagging the period as a known discontinuity rather than presenting it as continuous organic growth. Either approach is honest about what actually happened. Presenting it as one clean daily spike isn't.
The false positive in the other direction
The same mechanism protects against the opposite mistake: assuming every real spike is fake. Once a team has been burned by one reconnection artifact, the instinct can flip too far the other way, and a genuine viral moment gets waved off as "probably just a glitch" without checking. That's its own cost, because a real spike deserves real attention (understanding what caused it, doing more of it) and dismissing it loses that opportunity.
This is exactly why normalization needs to be handled by the reporting system itself, consistently, rather than by a person eyeballing every anomaly and guessing which ones are real. A system that knows precisely when a reconnect happened can distinguish a reconnection artifact from a genuine spike with certainty, instead of leaving that judgment call to whoever happens to be looking at the chart that day.
How to audit your own reporting for this
If you're not sure whether your current setup is vulnerable to this, there's a simple check: look back through your growth charts for any account that's ever been disconnected and reconnected, and see if there's an unexplained jump or drop right at that date. If there is, and nobody investigated it at the time, there's a real chance it's sitting in a report somewhere as a false data point right now.
A second check: ask whether your current tool's growth numbers get corrected retroactively when a reconnect happens, or whether the reconnect just becomes a permanent kink in the historical chart going forward. Tools that don't correct for this leave the artifact in place forever, which means every future report referencing that time period inherits the same error.
Where this connects to tag-level reporting
Normalized growth matters most where it's least visible: rolled-up numbers across many accounts. If a client's franchise footprint spans 12 locations and one of them had a reconnect this month, a blended growth number for the whole client absorbs that single account's artifact into an overall figure nobody thinks to question, because a 12-account average smooths out a lot of noise on its own. That doesn't fix the underlying error, it just hides it inside an aggregate.
Reporting broken out by tag doesn't have this blind spot in the same way, because it's still possible to drill into a single account's chart and spot the artifact directly. But the underlying fix still has to happen at the account level, in the growth calculation itself, before the number ever reaches a rollup. A rollup built on top of uncorrected per-account data is just an average of some correct numbers and some wrong ones, and averaging doesn't make wrong numbers right.
What to do if you find one
If a past spike or cliff in a client report turns out to be a reconnection artifact, the right move is correcting it directly rather than hoping nobody asks. Note the actual date of the reconnect, explain what happened in plain terms, and if possible, show a corrected version of the chart with the artifact smoothed out. Clients generally respond well to "we caught something in our own reporting and fixed it" and respond badly to finding an unexplained inconsistency themselves months later and wondering why nobody flagged it.
Questions worth asking any tool before you rely on its numbers
A short list, worth going through with any social analytics tool a business or agency depends on for reporting: does the tool know when an account was disconnected and reconnected, or does it just see 2 unrelated snapshots? Does historical data get corrected after the fact when a discontinuity is identified, or does the artifact stay in the chart permanently? And can a report be pulled for a specific date range that spans a known reconnect, without that range showing a fake spike or cliff?
If the honest answer to any of those is "we're not sure," that's worth finding out before the next client report goes out, not after someone asks an uncomfortable question about a number that doesn't add up.
The trust this protects
None of this is really about one chart looking slightly cleaner. It's about whether the numbers behind a multi-account or multi-client operation can be trusted at a glance, without someone having to manually sanity-check every spike before believing it. For an agency managing several client accounts through routine token refreshes and reauthorizations, that's not an occasional inconvenience, it's a recurring event that either gets handled automatically or becomes a recurring source of confusing, unexplained numbers in every monthly report.
Growth data only earns trust if it behaves the way growth actually behaves: gradual, explainable, tied to real causes. A tool that lets reconnection artifacts slide into the historical record is failing at the one job growth reporting has, telling you what actually happened, regardless of intent.